This is a story of how we identified a performance issue in EphemeraSearch. The performance issue itself isn’t very interesting (there is a very low chance that you will run into the same issue), but the methodology that we used might be useful if you need to troubleshoot performance issues in Django.
The problem
EphemeraSearch is an archive of old mail. It currently focuses on postcards. The postcards are scanned and made available online through the website. (It’s free by the way; so if you’re a genealogy or history fan, feel free to browse!) Postcards are then transcribed and indexed, meaning that you can search for the name of an ancestor, or a place where they lived, and if we have some of their postcards, they might turn up.
Recently, we’ve rolled out eBay integration, meaning that people selling old postcards on eBay can automatically add their collections to our website with very little effort. This was a big success, and resulted in thousands of new postcards being added to the site. Yay! 🎉 But at the same time, performance started to degrade. Boo! 😭
When we hit the point where just displaying a postcard would take a few seconds, it was clear that we had to find the cause of the problem and address it.
At first, it looks like an index problem. However, while we can’t be sure that the indexes are perfect, loading individual postcards from the database (for instance with the Django ORM) was extremely fast. So what could it be?
We had to dig deeper!
First investigations
After digging a bit in our APM, we quickly identified one request in particular that was way slower than expected: the API request to fetch a single postcard.
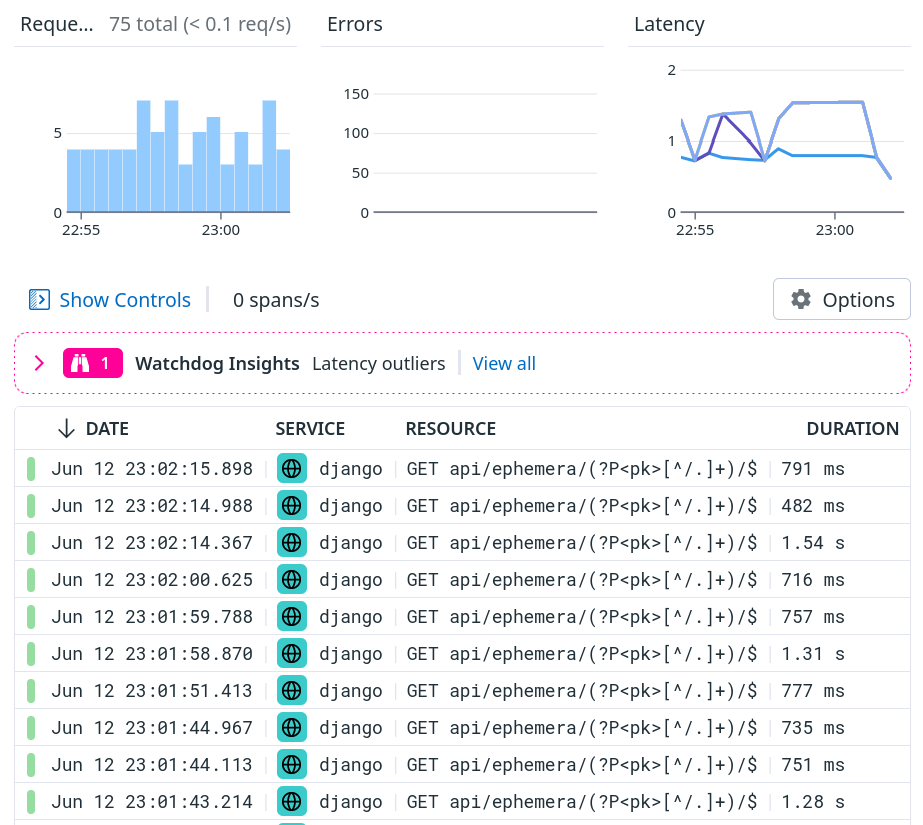
This should take 10-100ms maybe; not 500ms-1.5s; and it could definitely explain the slowdowns that our users were seeing.
We looked at the flame graph (showing which function calls were taking how long), but unfortunately, we were stumped pretty quickly:
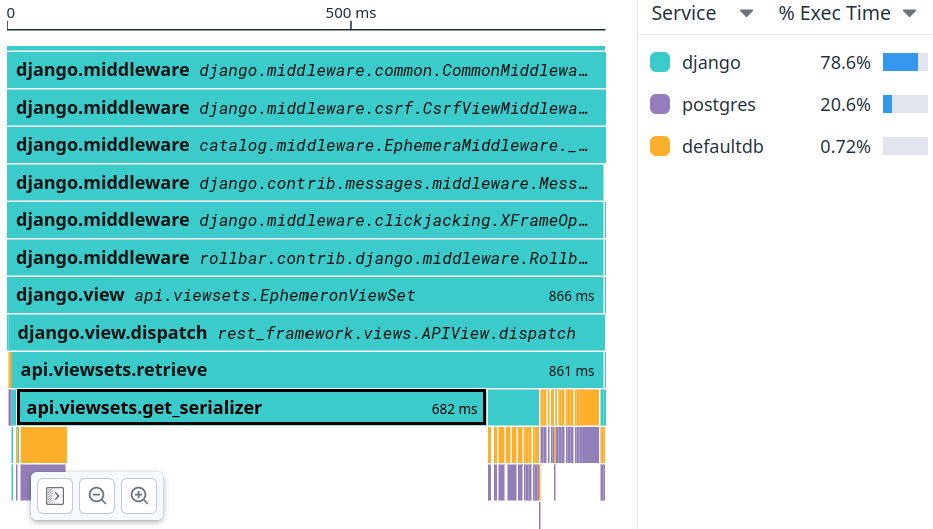
A lot of time seems to be spent in that api.viewsets.get_serializer
method, but it’s not clear why. Trying to drill down in that function
showed a bajillion (really, hundreds of thousands!) of small individual calls but nothing that seemed obvious.
It turns out that the problem was right there; but we didn’t see it at first, unfortunately!
We had to dig even deeper.
Reproducing locally
At that point, we felt like we were hitting the limits of what we could do merely by tinkering with production or pre-production environments. We had to reproduce the issue locally!
We established a baseline (the output below has been edited for clarity):
$ hey -n 10 -c 1 "http://localhost:8000/api/ephemera/..."

Summary:
  ...
  Average:  	0.3526 secs
  ...
We definitely recommend checking out hey by the way; it’s a bit like
a modern ab (Apache Benchmark), letting you quickly get neat histograms
of the latency of a service.
Note that the same request that took about 800ms on our production platform (powered by [Heroku]) took only 350ms locally. This can be a bit surprising at first: why would a local development machine be faster than a good hosting server? There can be multiple explanations:
- our local development machine isn’t very busy otherwise, and lots of Intel/AMD CPUs can boost their clock when running a single core, often resulting in nice single-thread performance compared to a server with dozens of cores but truly using all of them at the same time;
- on our local development platform, the database is local, and the lower latency can yield performance improvements, especially if there are many database requests (each requiring a full round-trip to the database);
- …
Later, we found out that the issue was CPU bound; which probably explains why, retrospectively, our local environment performed relatively well compared to the production platform.
Research
Our web frontend isn’t “pure” Django. It’s a React app that communicates with an API, itself implemented on top of Django using Django REST Framework (or DRF).
DRF is pretty amazing because it makes it convenient to implement Django views providing REST APIs in very customizable ways, especially when objects reference (or include) other objects and you want to control how things are serialized (to JSON in our case) and validated (when handling POST, PUT, or PATCH requests, for instance).
We did a bit of research, and found two great resources about DRF performance:
- Improve Serialization Performance in Django Rest Framework by Haki Benita,
- Web API performance: profiling Django REST framework by Tom Christie.
We learned a lot by reading these blog posts; but… they didn’t take us closer to solving our bug. They even left us more confused. Specifically, Tom Christie’s post showed requests where database queries took 66% of the time before optimizations, and 80% after optimizations. In our scenario, database queries take only 20% of the time.
Obviously we were doing something very wrong!
Profiling
We tried to evaluate the performance of DRF serializers (carefully importing the right modules, instantiating the right classes, etc) but at the end, we found that performance to be acceptable and in line with expectations. (We won’t reproduce the code here because it wasn’t super helpful.)
At this point, we decided on two things.
- We wanted to reproduce the request execution in a Python interpreter, as closely as possible to the real thing.
- Then we would use the Python profiler to find hotspots.
This is the technique that we came up with, to reproduce our request.
Note that the following code was executed in Django’s shell_plus
environment.
import django.test
import django.urls

# This is our test request, broken down with URI + Query String.
uri = "/api/ephemera/13373/"
qstring = "?img=2&expand=~all&referrer=/ephemera/13373/"

# Let's build a request object...
factory = django.test.RequestFactory()
request = factory.get(uri+qstring)

# Now invoke Django's URL router to find the view
# that is supposed to handle the request...
resolvermatch = django.urls.resolve(uri)

# Then invoke that view.
resolvermatch.func(request, *resolvermatch.args, **resolvermatch.kwargs)

# We can get a performance baseline with IPython %timeit:
%timeit resolvermatch.func(request, *resolvermatch.args, **resolvermatch.kwargs)
Hopefully, the snippet above should work for most GET requests,
regardless of the Django apps and frameworks that you’re using.
There are two drawbacks, though:
- it shortcuts most (if not all?) of Django’s middlewares,
- it probably requires some adaptation if you want to benchmark
or profile anything else than
GETrequests.
In our case, we didn’t care about the middlewares, because our APM showed that most of the time seemed to go in our app - or, to phrase things differently, that the middlewares’ overhead was hardly measurable.
The next step was to profile our request, to see where CPU time was going - hopefully with more details than in our APM tool.
This can be done like this:
import cProfile
cProfile.run(
  "for i in range(10): resolvermatch.func(request, *resolvermatch.args, **resolvermatch.kwargs)",
  sort="tottime"
)
When I was profiling Python code back in college (more than 20 years ago🫣) this is more or less what I was doing; but we now live in more modern times, and there are some pretty neat tools to show visual representations of Python profiling information; for instance SnakeViz and Tuna.
They’re both one pip install away; and after installing them,
we could do:
# Write the profiling information to a file
cProfile.run(
  "for i in range(10): resolvermatch.func(request, *resolvermatch.args, **resolvermatch.kwargs)",
  "/tmp/pstats"
)

# Execute snakeviz or tuna on that file
# (this will run a web server and open a page in your browser)
!snakeviz /tmp/pstats
!tuna /tmp/pstats
(If you’re surprised by this ! syntax: we’re using IPython here,
and this just means “shell out and execute snakeviz in tuna in
a subshell”.)
This is what SnakeViz showed us:
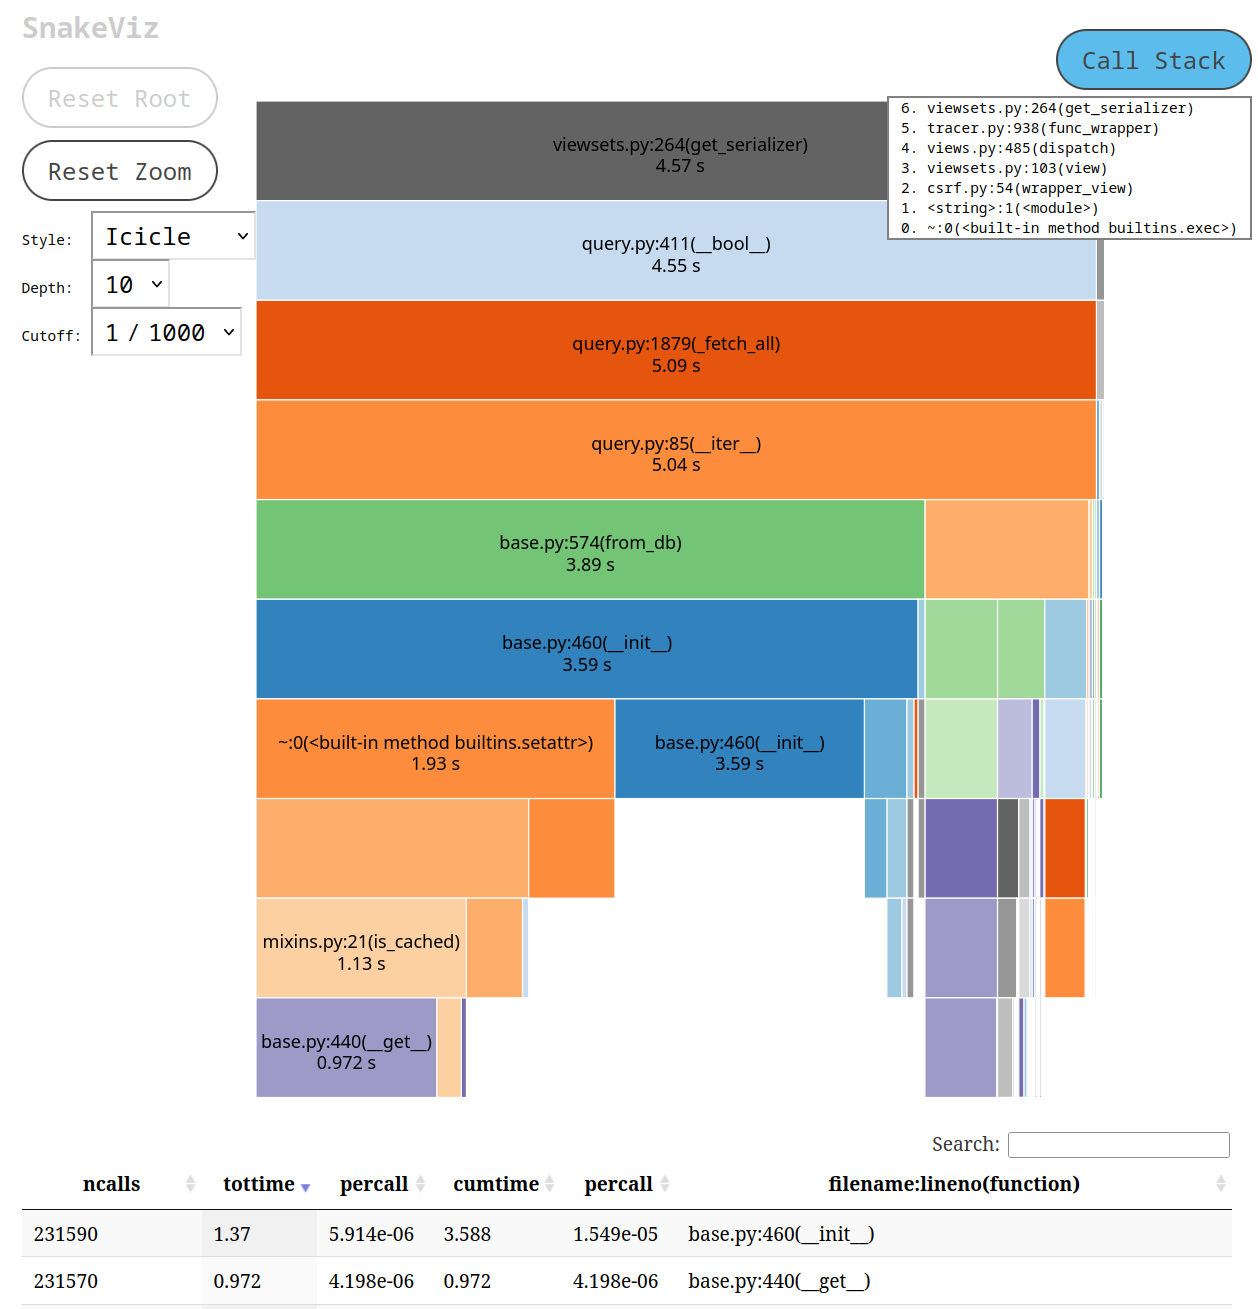
The thing that caught our attention was the 231,590 calls to base.py:__init__
that you can see at the bottom of the screen.
Why the heck did we create 231,590 new instances?!? And, new instances of what?!?
Retrospectively, at that point, the answer was right in front of us -
but we didn’t see it quite yet. (If you see it, leave a comment,
subscribe and hit the bell congrats! 🎊🎖️🐍)
Print to the rescue
There were certainly more elegant ways to find what was going on,
but we decided to edit base.py (specifically, django/db/models/base.py
located in our virtualenv lib/python-XXX/site-packages) to sprinkle
some print statements at the beginning of that constructor:
class Model(AltersData, metaclass=ModelBase):
	def __init__(self, *args, **kwargs):
    	print(self.__class__, args and args[0])
    	...
This would show us which Model subclass was instantiated, and
its arguments.
Then, we repeated our test request.
And to our greatest surprise, we saw that when accessing a single
postcard, our code was actually instantiating every single postcard
in the database. The output was filled with lines like this, for
every single postcard (they correspond to the Ephemeron model):
...
<class 'models.Ephemeron'> 896
<class 'models.Ephemeron'> 895
<class 'models.Ephemeron'> 894                                            	<class 'models.Ephemeron'> 893
...
Again, hindsight is 20/20: the number of calls to base.py:__init__
corresponded very closely to the number of postcards in the database
at that point; so we could probably have guessed what was being
instantiated. But this one was a clear confirmation rather than
(educated) guesswork!
Breakpoint
The next step was to find out what was creating all these instances.
We went for a low-tech but super effective method: good old breakpoint()!
We changed the constructor like this, so that when it hit an object
with a pk of 20000, it would break to the debugger, giving us
an opportunity to check the stack trace and the sequence of callers:
class Model(AltersData, metaclass=ModelBase):
	def __init__(self, *args, **kwargs):
    	print(self.__class__, args and args[0])
    	if args and args[0]==20000: breakpoint()
    	...
Note that we didn’t put a straight, unconditional breakpoint here,
because there are many instances that get created before we hit
the “problematic” ones. This was a way to make sure that we’d trigger
exactly for what we were looking for, instead of having to repeatedly
press c (for continue) in the debugger.
After that, we sent one more test request. Our breakpoint was hit!
We walked up and down the stack (with up and down) until we saw this:
ipdb> l
	285         	logger.critical(f"unknown action requested: {self.action}")
	286
	287     	#  logger.verbose(f"{self} getting serializer {self.serializer_class}")
	288     	ret = super(DynSerializerModelViewSet, self).get_serializer(*args, **kwargs)
	289     	try:
--> 290         	if (
	291             	self.queryset
	292             	and ret.Meta.model != self.queryset.model
	293             	and settings.DJANGO_ENV == "development"
	294         	):
	295             	embed(header="wrong models")
The problem came from the if self.queryset. This tries to interpret
the QuerySet as a boolean value (or, to say it differently: it casts
the QuerySet to a boolean value). It does that by calling the __bool__()
method on the QuerySet. If we look again at the SnakeViz screenshot above,
we’ll see that __bool__() call. In other circumstances, that might have
been a dead giveaway. In that case, we missed it. Also, for unknown reasons,
it didn’t show up in the APM tool.
That bit of code was leftover debugging code that wasn’t used anymore
(and as you can notice from the rest of the test condition, it only
gets used in development anyway) so we removed it, and repeated
our tests locally:
$ hey -n 10 -c 1 "http://localhost:8000/api/ephemera/...

Summary:
  ...
  Average:  	0.1070 secs
  ...
100ms instead of 350ms, i.e. 3.5x faster. Not bad!
That piece of leftover debugging code was in the get_serializer method,
i.e. exactly what our APM flame graph was showing us in the beginning.
Unfortunately, we missed that boolean QuerySet evaluation during our
first inspection!
Aftermath
We deployed the “fix” to preproduction, and the request duration was divided by 5:
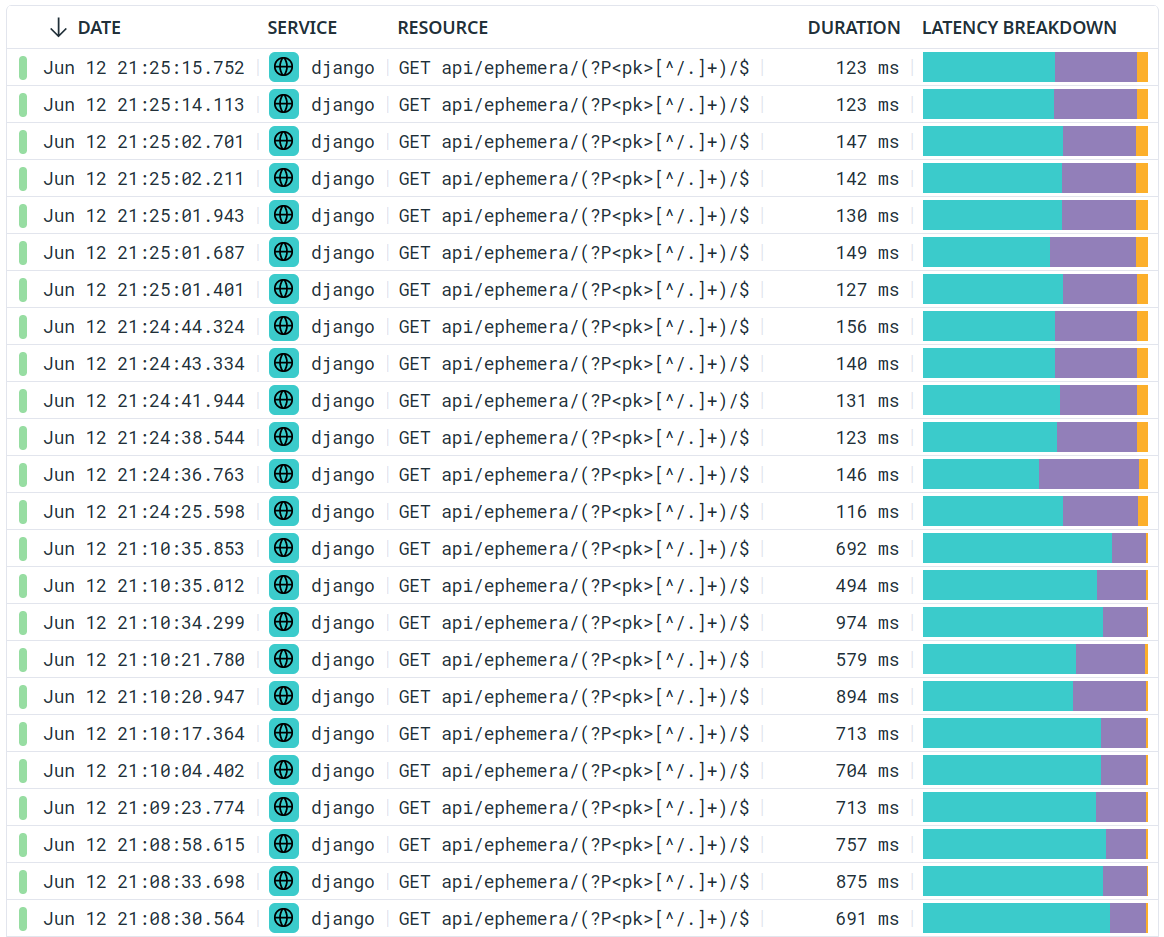
The fix made it to production, with similar results.
The nice thing is that we can now address other performance problems which were previously hidden by that one. Yay!
So, what did we learn?
Evaluating a QuerySet in a boolean context will evaluate the query (this is clearly mentioned in the QuerySet API reference) and can sometimes construct model instances for every row in the query result. The latter part was unexpected, and might be caused by something weird in our QuerySet. (Naively, we’d have expected the query to merely check if there was at least one result and not construct the whole thing?)
It pays to pay attention to what our tools are telling us. There were some very valuable hints early on in our investigation, but we failed to notice them. But that’s OK, and that’s also why we have multiple investigation tools and techniques: so that we can catch with one the stuff that with missed with another.
Simulating Django requests is relatively straightforward,
and the method that we used here (with django.test and django.urls)
is probably transposable to other Django requests - whether you use
DRF or not. The general idea is also probably transposable to other
frameworks and other languages.
Reproducing problems locally can be super helpful, because it allows some crude-but-effective hacks - like instrumenting the Django ORM base model constructor to see which instances were created, or even adding a conditional breakpoint there to see what’s going on.
Leaving dead code is probably not a good idea in the first place; but we’ve all been there - adding some temporary hacks when tracking a really weird bug, and forgetting to remove them later. This is why reproducing problems locally is the way: it saves us the long round-trip (commit to a branch - deploy to staging - test stuff - repeat) and once we have identified the fix, it’s easier to commit just what we need and leave out the rest.
That’s it! Again, while the original bug was very specific to our environment, we hope that the general technique and workflow that we used might be useful to others some day. Thanks for reading; and if you enjoyed this, go check some postcards on EphemeraSearch!